lm_model <- lm(body_mass_g ~ bill_length_mm + bill_depth_mm + flipper_length_mm, data = df)5 Linear Regression
Linear regression is a statistical method used to model the relationship between a continuous outcome and one or more predictor variables. It fits a line (or plane) that best describes how the outcome changes as the predictors change, allowing us to interpret relationships and make predictions.
5.1 Fit the Model
We will predict body mass using several body measurements.
5.2 Inspect the Model
summary(lm_model)
Call:
lm(formula = body_mass_g ~ bill_length_mm + bill_depth_mm + flipper_length_mm,
    data = df)

Residuals:
     Min       1Q   Median       3Q      Max
-1051.37  -284.50   -20.37   241.03  1283.51

Coefficients:
                   Estimate Std. Error t value Pr(>|t|)
(Intercept)       -6445.476    566.130 -11.385   <2e-16 ***
bill_length_mm        3.293      5.366   0.614    0.540
bill_depth_mm        17.836     13.826   1.290    0.198
flipper_length_mm    50.762      2.497  20.327   <2e-16 ***
---
Signif. codes:  0 '***' 0.001 '**' 0.01 '*' 0.05 '.' 0.1 ' ' 1

Residual standard error: 393 on 329 degrees of freedom
Multiple R-squared:  0.7639,    Adjusted R-squared:  0.7618
F-statistic: 354.9 on 3 and 329 DF, p-value: < 2.2e-16coef(lm_model) (Intercept) bill_length_mm bill_depth_mm flipper_length_mm
-6445.476043 3.292863 17.836391 50.762132 5.3 Visualize the Relationship
To build intuition, we can visualize one predictor against the outcome and overlay the fitted regression line.
ggplot(df, aes(x = flipper_length_mm, y = body_mass_g)) +
  geom_point() +
  geom_smooth(method = "lm") +
  labs(title = "Linear Regression: Body Mass vs Flipper Length")
`geom_smooth()` using formula = 'y ~ x'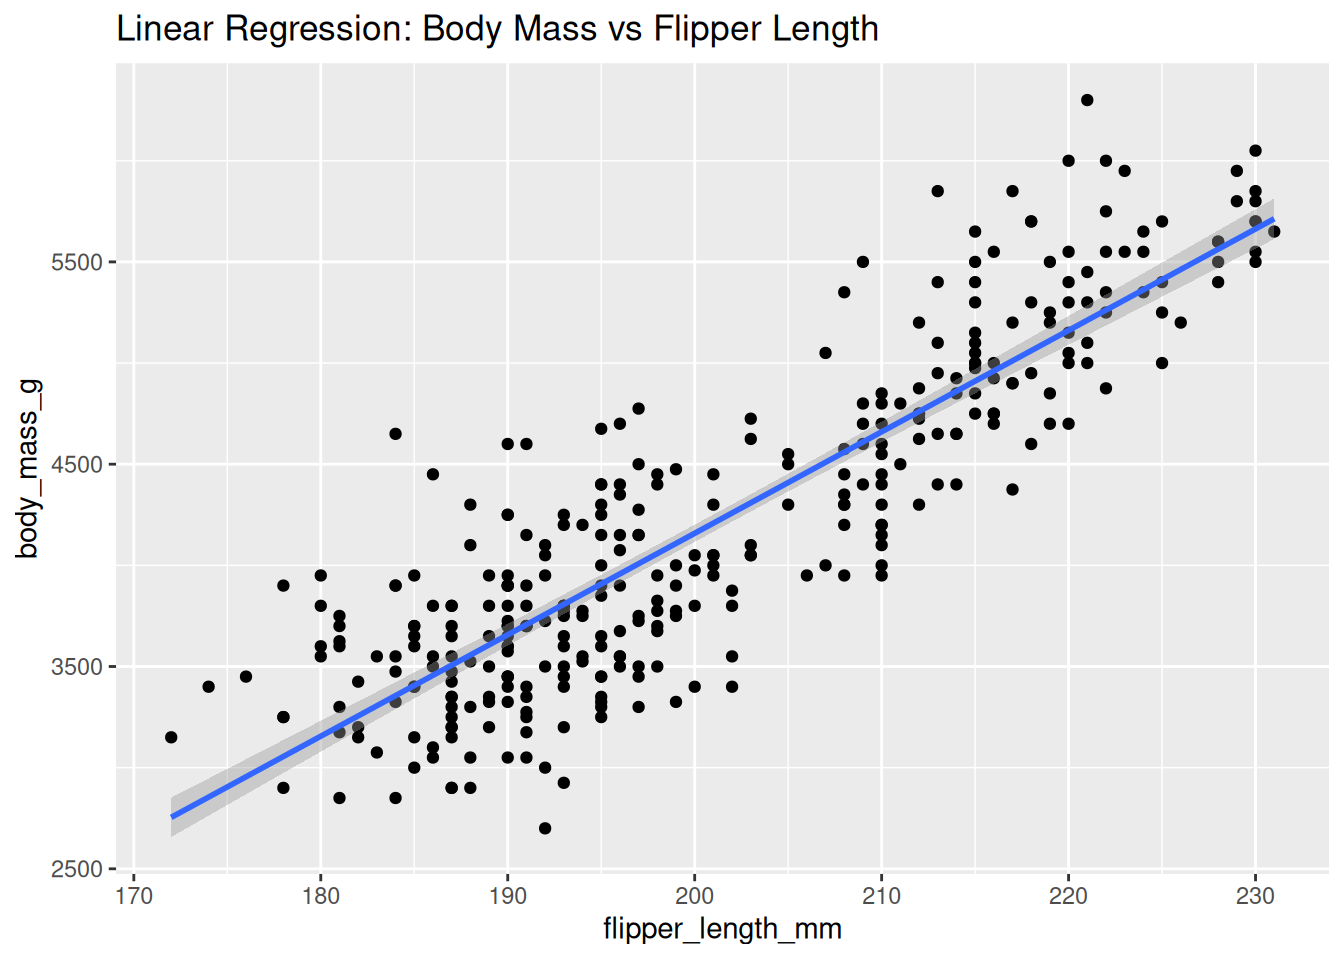
5.4 Key Takeaways
- Linear regression helps quantify relationships between variables.
- Coefficients indicate how the outcome changes with each predictor.
- Visualization is useful for understanding model fit and interpreting results.