range(df$flipper_length_mm)[1] 172 231When we use a model to make predictions, it matters whether those predictions fall within the range of data we actually observed. Predictions made inside the observed range are generally more trustworthy, while predictions outside that range require much more caution.
Interpolation is usually safer because the model is working in a part of the data space it has actually seen. Extrapolation is riskier because it assumes the same relationship continues beyond the observed data, which may not be true.
Before making predictions, it is helpful to inspect the range of the predictor variable.
range(df$flipper_length_mm)[1] 172 231This tells us the smallest and largest flipper lengths observed in the data.
Here we make a prediction using values that fall within the range of the dataset.
predict(lm_model, newdata = data.frame(
  bill_length_mm = 45,
  bill_depth_mm = 17,
  flipper_length_mm = 200
))
1
4158.348 Because these values are similar to observations in the dataset, this is an example of interpolation.
Now we make a prediction using values outside the observed range.
predict(lm_model, newdata = data.frame(
  bill_length_mm = 65,
  bill_depth_mm = 25,
  flipper_length_mm = 260
))
1
7412.624 This is an example of extrapolation. Even though R will still return a prediction, we should be cautious about interpreting it because the model is being asked to make predictions in a region where it has no data.
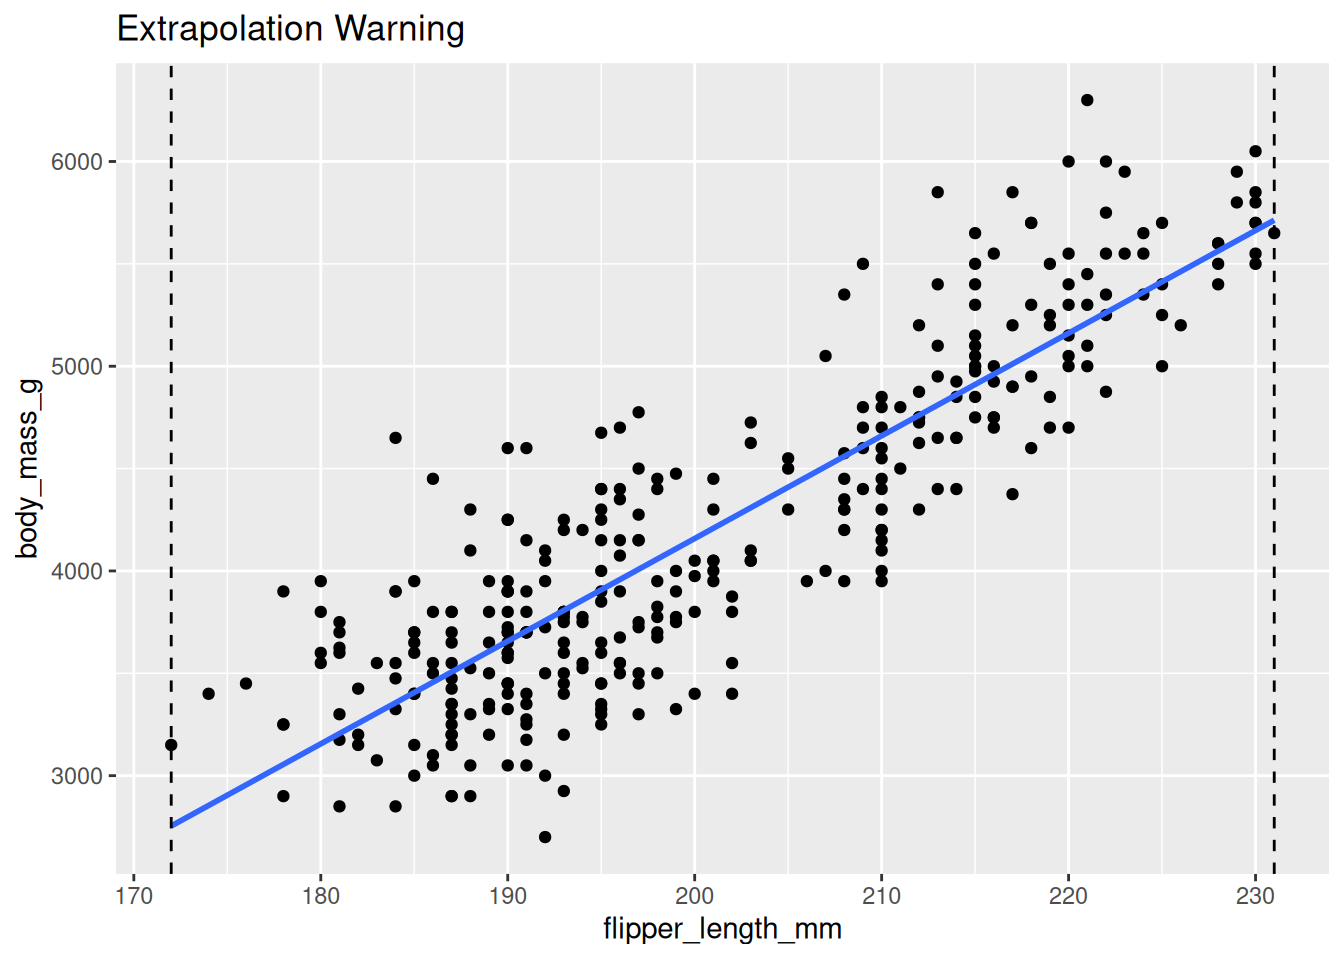
The dashed vertical lines below mark the observed range of flipper lengths in the data.
ggplot(df, aes(x = flipper_length_mm, y = body_mass_g)) +
  geom_point() +
  geom_smooth(method = "lm", se = FALSE) +
  geom_vline(xintercept = range(df$flipper_length_mm), linetype = "dashed") +
  labs(title = "Extrapolation Warning")
`geom_smooth()` using formula = 'y ~ x'