1 Why Visualize?
“Graphical excellence is that which gives to the viewer the greatest number of ideas in the shortest time with the least ink in the smallest space.”
— Edward Tufte, The Visual Display of Quantitative Information (2nd ed.)
1.1 Anscombe’s Quartet
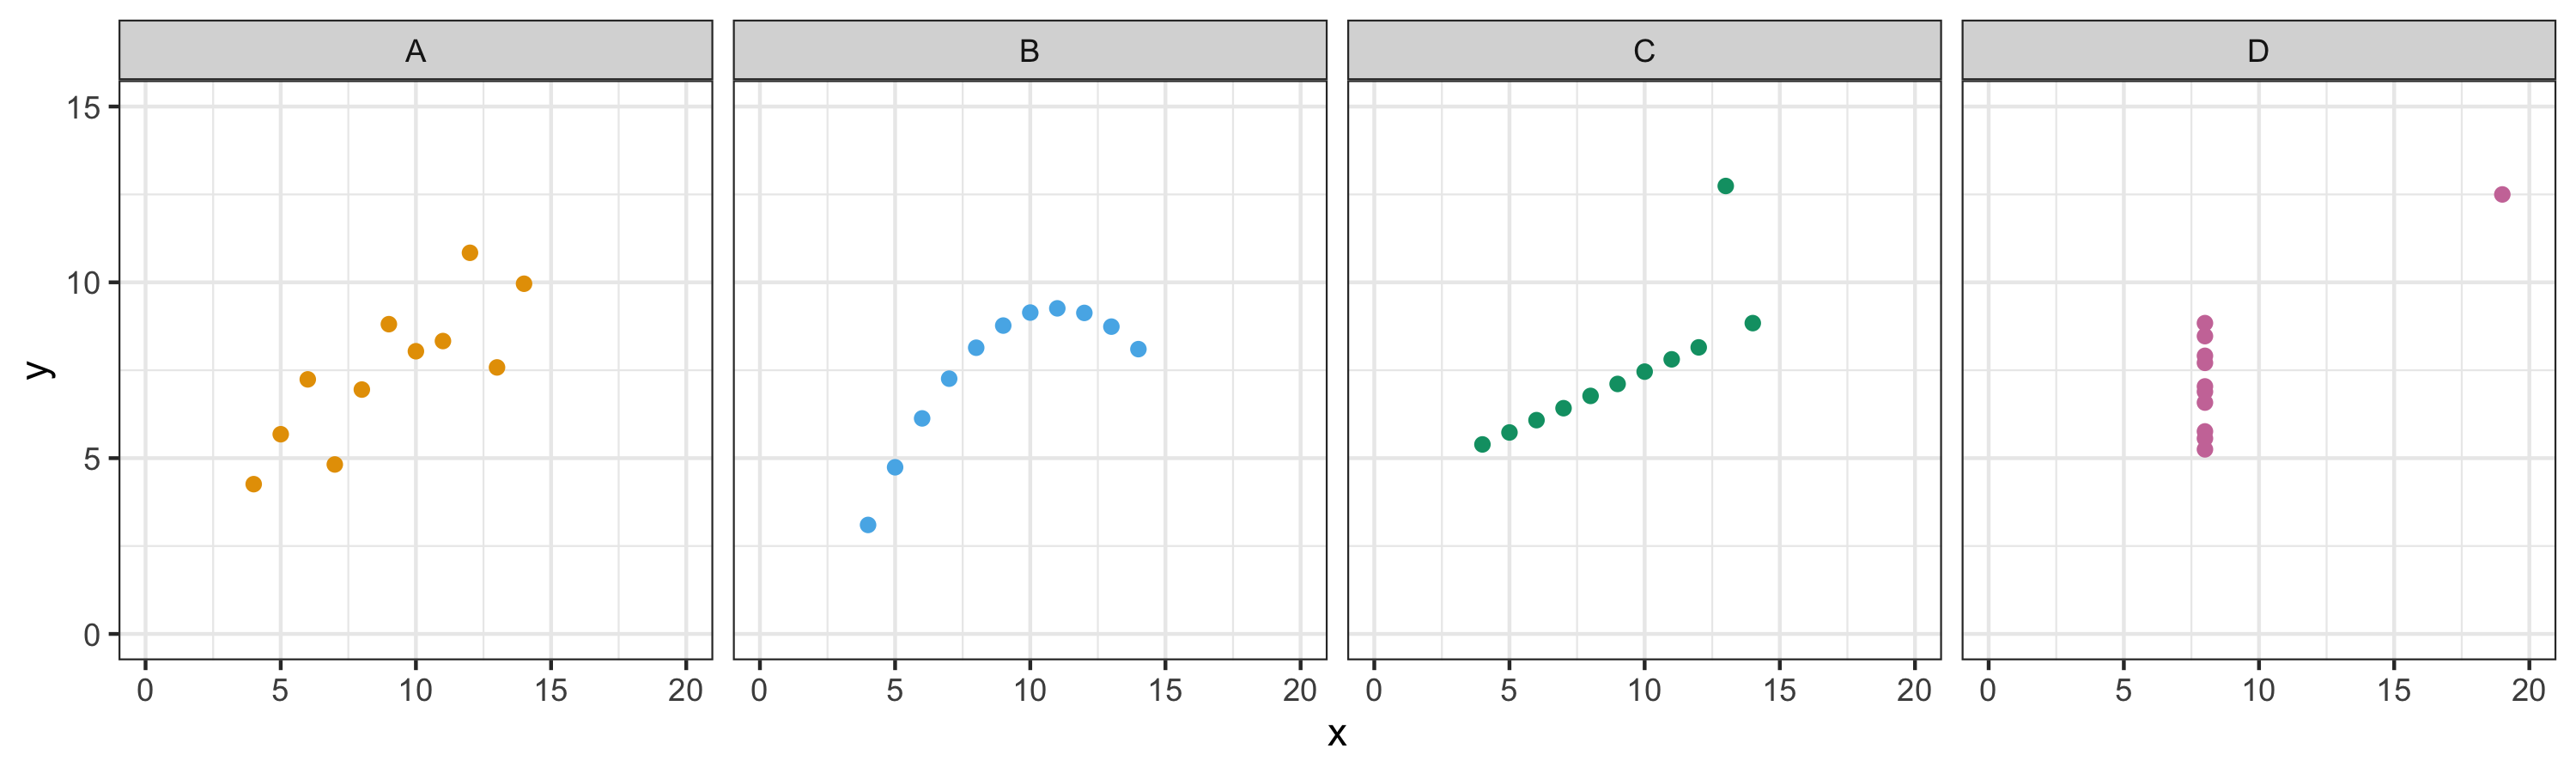
A famous example that illustrates why visualizing your data is important is Anscombe’s Quartet. Looking at the 4 plots below, what do you notice?
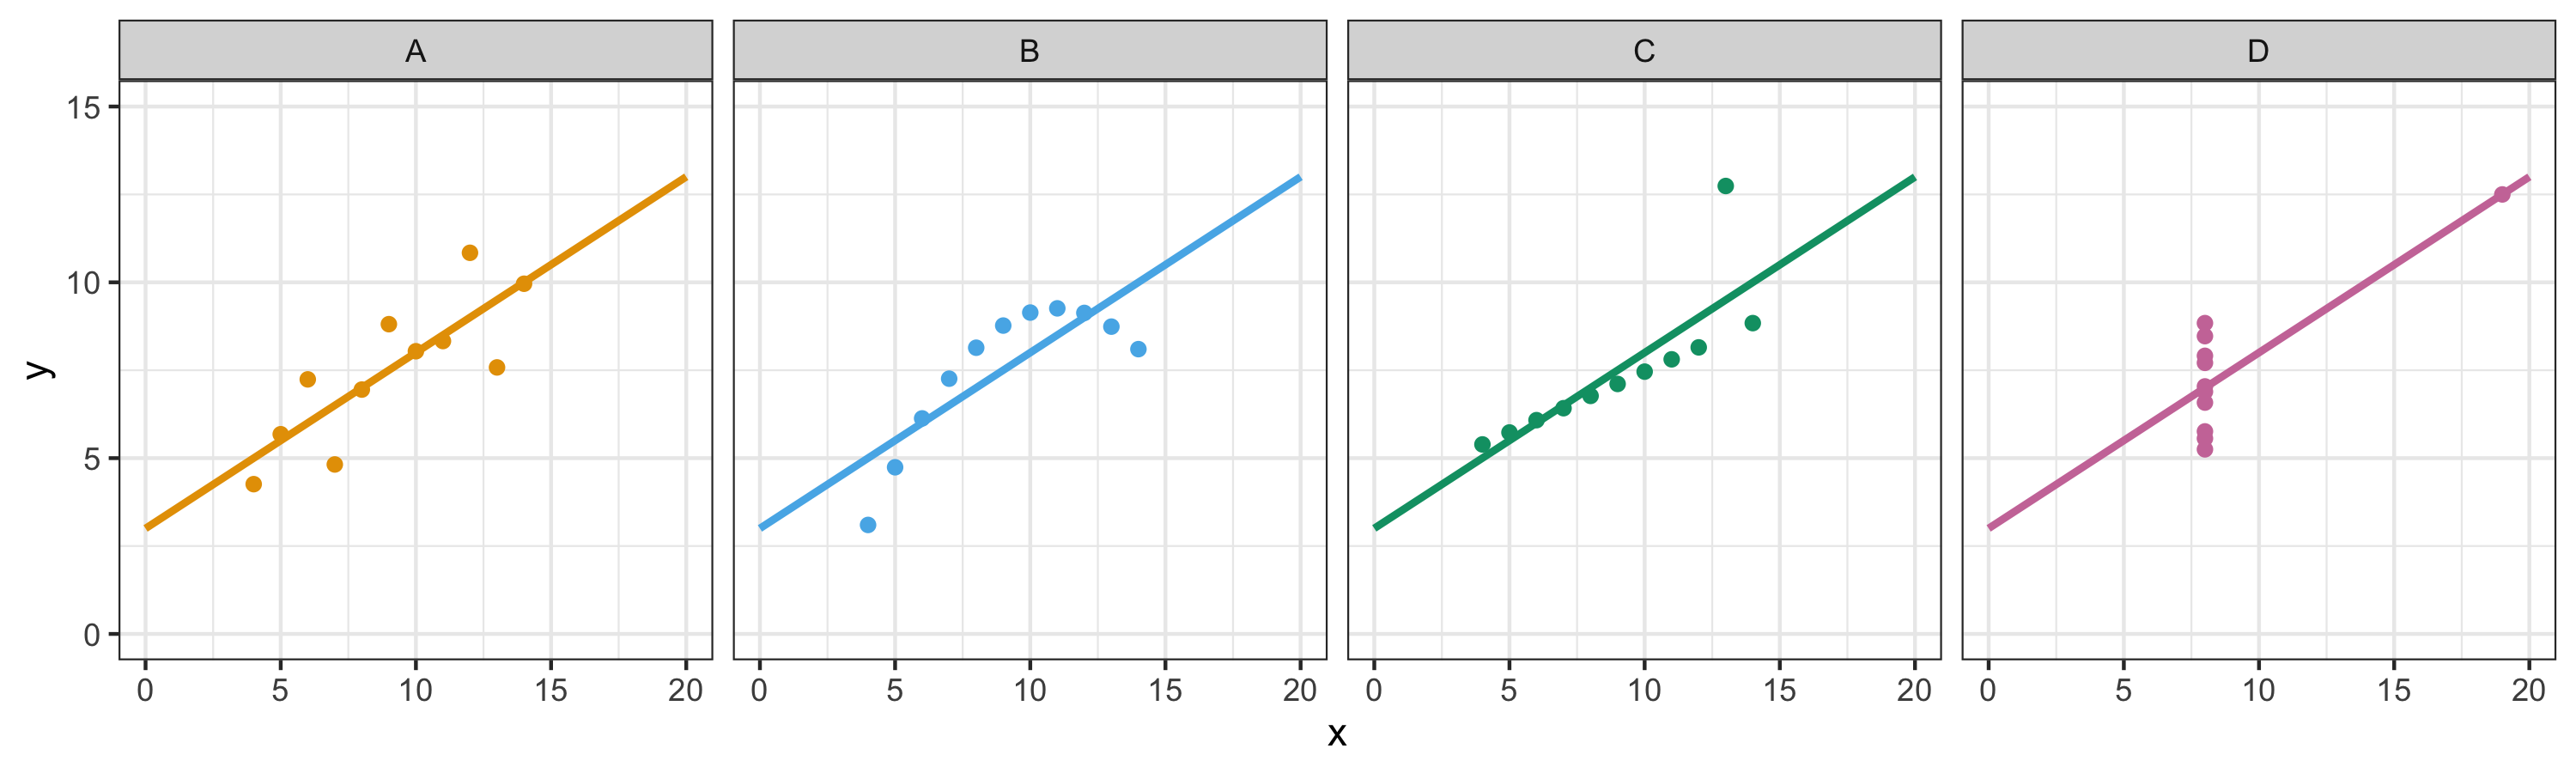
Here are the same 4 plots, with a “best fit” line draw through them. Notice they all fit the exact same line.
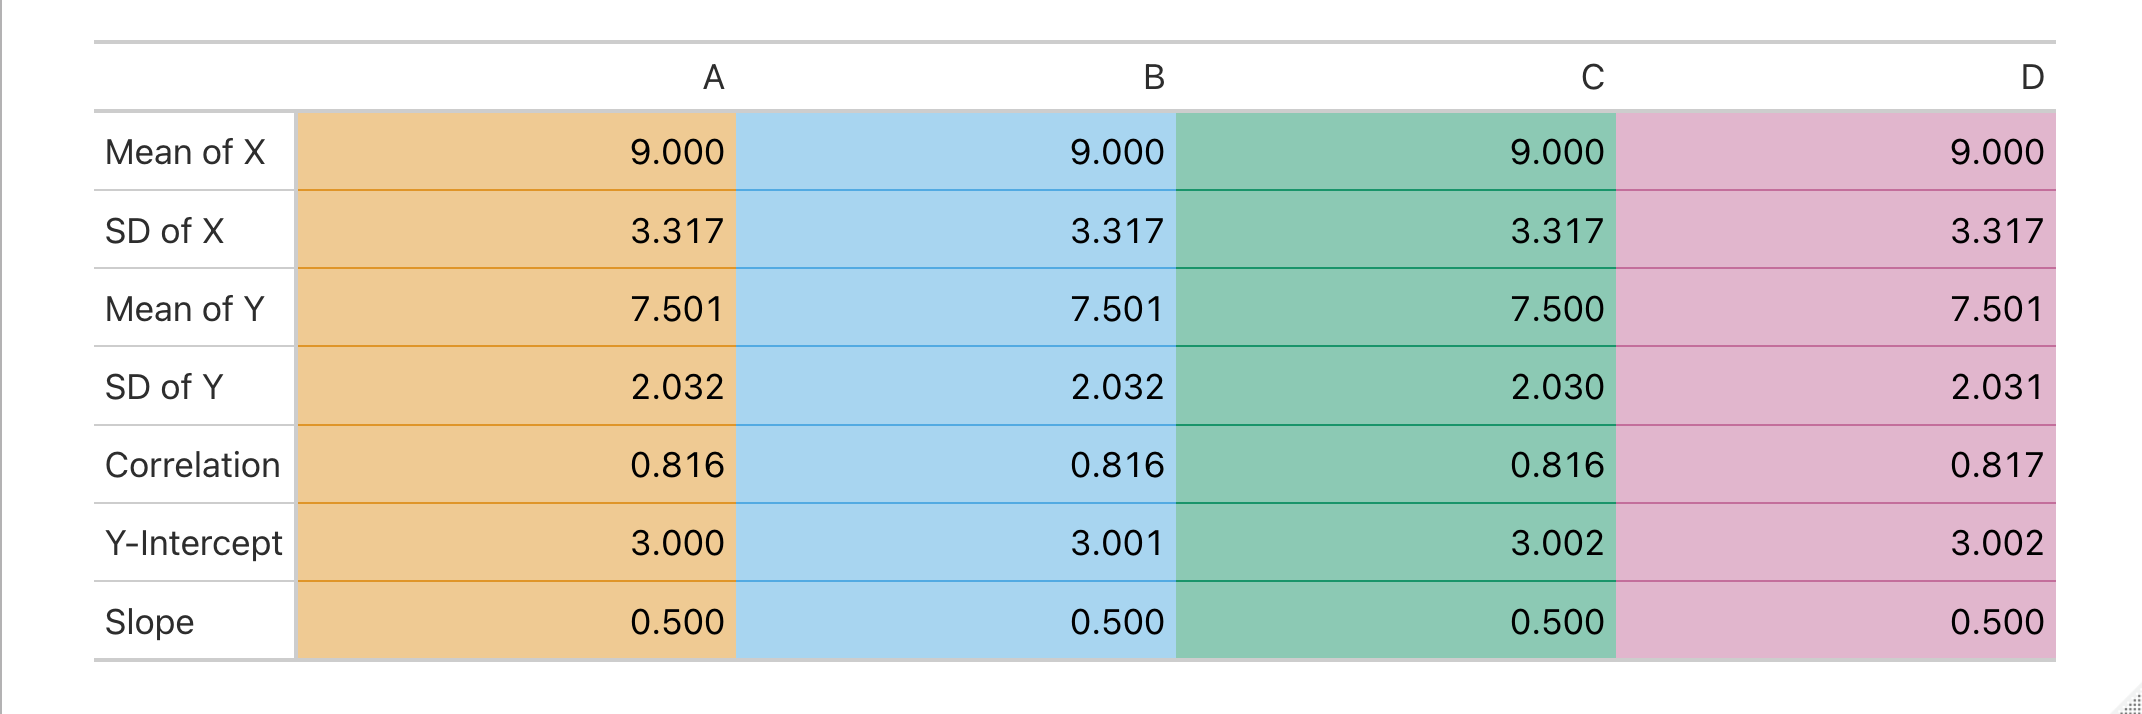
 Here are statistical summaries of the data in each plot. What do you notice?
1.2 The Datasaurus Dozen
Another classic, slightly more fun example is the Datasaurus Dozen, which all have the same statistical properties:
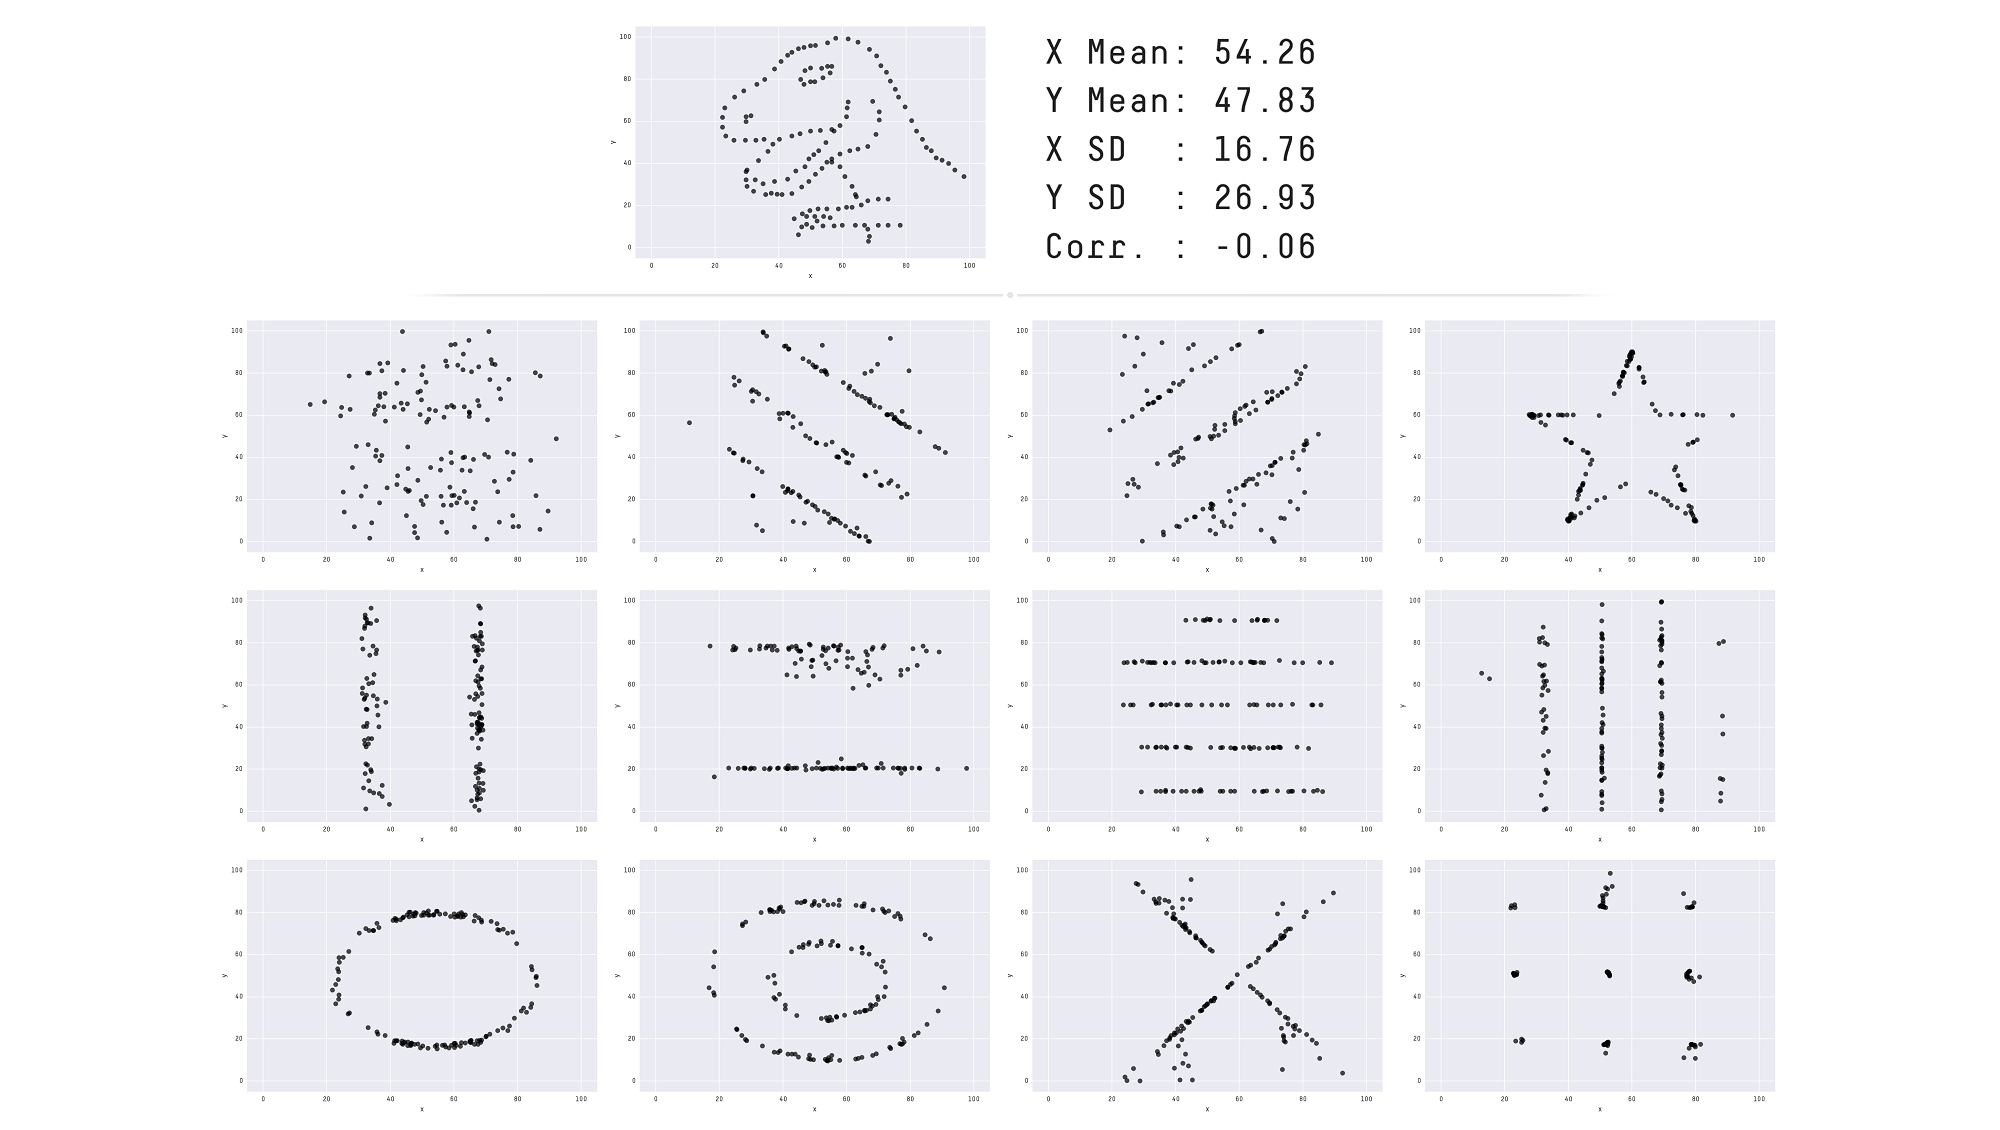
To see more: https://www.research.autodesk.com/publications/same-stats-different-graphs/
1.3 Summary
- To efficiently communicate ideas
- Some patterns can only be seen visually
- Aesthetics sell better than facts. See this paper on the aesthetic fidelity effect.
- To make data more ingestible