Call:
lm(formula = mpg ~ wt, data = mtcars)
Residuals:
Min 1Q Median 3Q Max
-4.5432 -2.3647 -0.1252 1.4096 6.8727
Coefficients:
Estimate Std. Error t value Pr(>|t|)
(Intercept) 37.2851 1.8776 19.858 < 2e-16 ***
wt -5.3445 0.5591 -9.559 1.29e-10 ***
---
Signif. codes: 0 '***' 0.001 '**' 0.01 '*' 0.05 '.' 0.1 ' ' 1
Residual standard error: 3.046 on 30 degrees of freedom
Multiple R-squared: 0.7528, Adjusted R-squared: 0.7446
F-statistic: 91.38 on 1 and 30 DF, p-value: 1.294e-108 External Packages
8.1 Installing Packages
One of the biggest strengths of R is its large ecosystem of packages (also called libraries). Packages extend R by adding new functions for data analysis, statistics, visualization, and machine learning. Thousands of packages are available through the Comprehensive R Archive Network (CRAN).
To use a package, you first install it (one time) and then load it into your session.
install.packages("ggplot2")
library(ggplot2)
Once loaded, the functions from the package become available for use.
Packages are commonly used to:
- Perform statistical modeling
- Manipulate and analyze datasets
- Create high-quality visualizations
- Extend R with specialized tools
8.2 Built-in Statistical Functions
R already includes many powerful statistical tools in its base and stats packages, which are loaded automatically when R starts.
For example, you can run statistical tests or fit models directly.
8.2.1 Linear Regression
The lm() function fits a linear model.
This model estimates how vehicle weight (wt) affects fuel efficiency (mpg).
8.2.2 t-tests
You can also perform hypothesis testing using functions such as t.test().
Example: Compare the mean miles-per-gallon for cars with different transmission types.
t.test(mpg ~ am, data = mtcars)
    Welch Two Sample t-test

data:  mpg by am
t = -3.7671, df = 18.332, p-value = 0.001374
alternative hypothesis: true difference in means between group 0 and group 1 is not equal to 0
95 percent confidence interval:
 -11.280194  -3.209684
sample estimates:
mean in group 0 mean in group 1
       17.14737        24.39231
These built-in statistical tools make R a powerful environment for quantitative analysis.
8.3 Example: Creating Visualizations with ggplot2
The ggplot2 package is one of the most widely used tools for creating data visualizations in R. It implements the Grammar of Graphics, which builds plots layer by layer.
For example, we can visualize the relationship between engine weight and fuel efficiency using the built-in mtcars dataset.
library(ggplot2)

ggplot(mtcars, aes(x = wt, y = mpg)) +
  geom_point()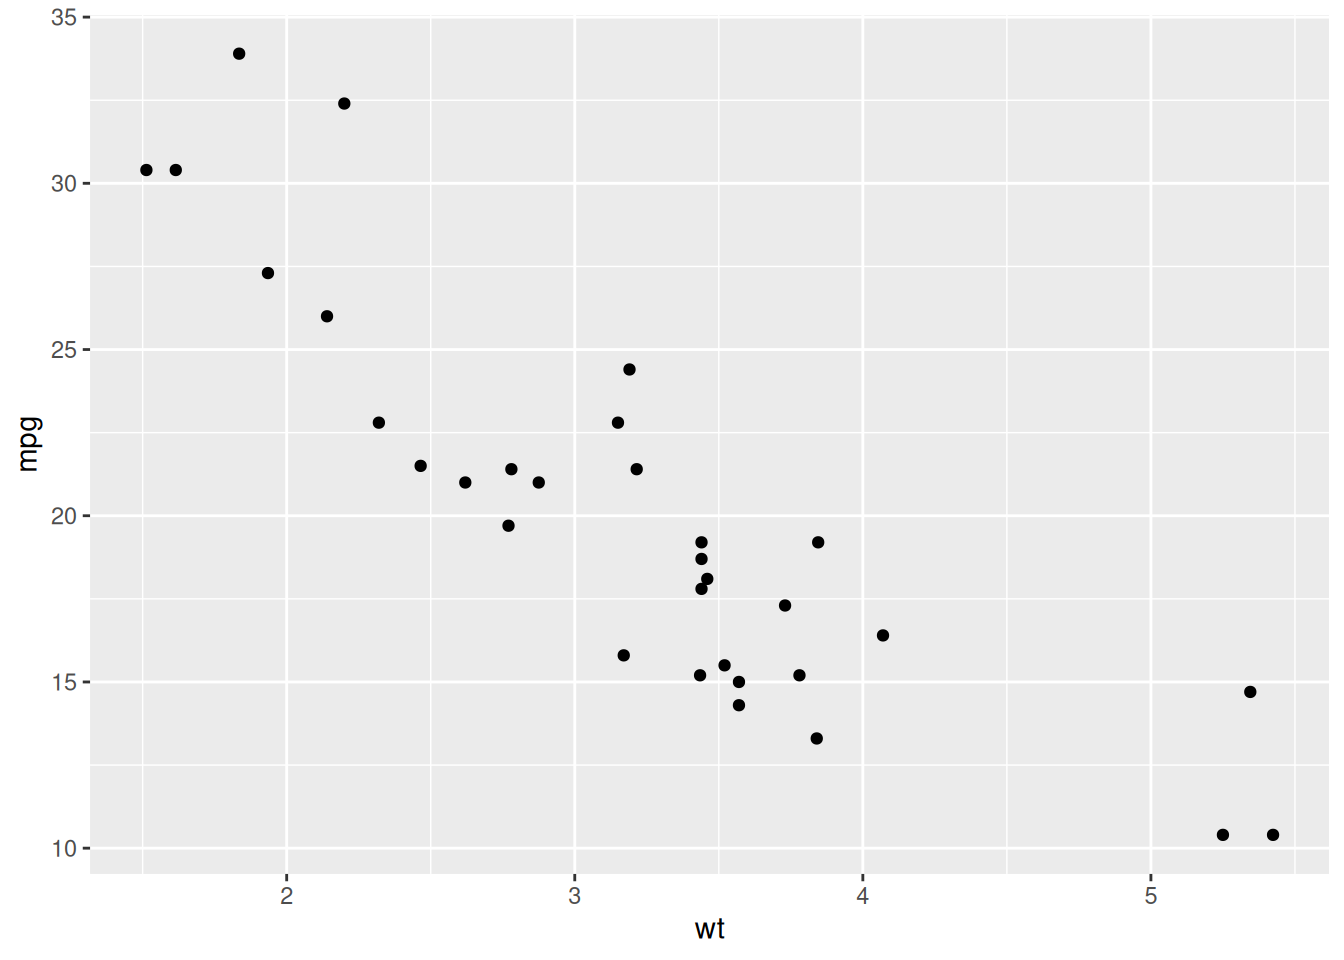
This creates a scatter plot where:
-
wt(vehicle weight) is on the x-axis -
mpg(miles per gallon) is on the y-axis
Additional layers can be added to customize the plot.
ggplot(mtcars, aes(x = wt, y = mpg)) +
  geom_point() +
  geom_smooth(method = "lm") +
  labs(
    title = "Fuel Efficiency vs Vehicle Weight",
    x = "Weight",
    y = "Miles per Gallon"
  )
`geom_smooth()` using formula = 'y ~ x'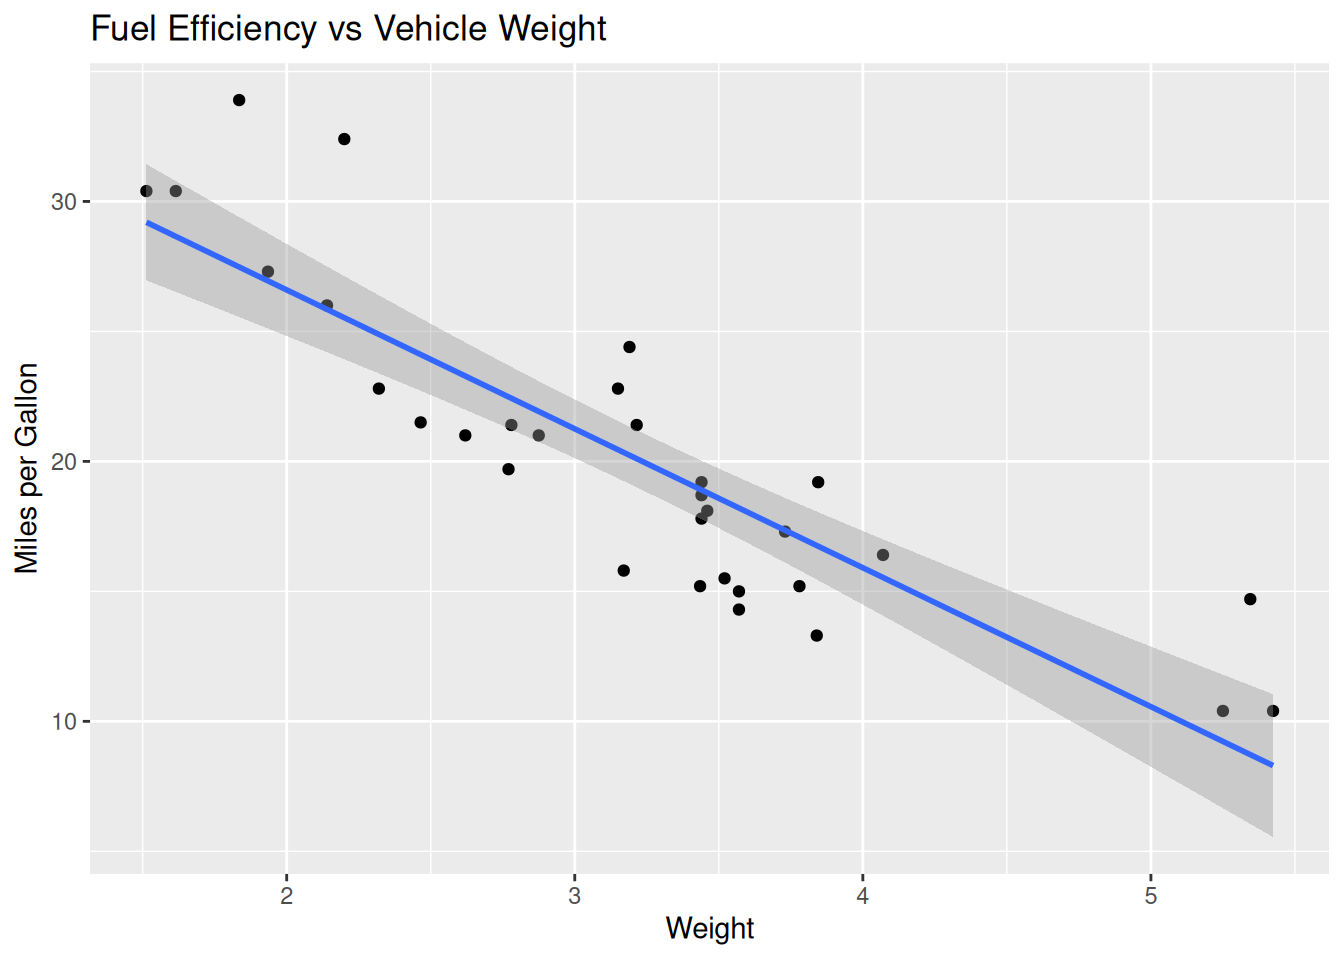
8.4 Looking Ahead
While base R already includes powerful statistical tools, many analysts extend their workflows with additional packages. Some commonly used packages include:
-
ggplot2– data visualization
-
dplyr– data manipulation
-
tidyr– reshaping data
Together these packages form part of the tidyverse, a widely used ecosystem for data science in R.
In more advanced courses and projects, you will learn how to combine statistical modeling, visualization, and data manipulation to build complete data analysis workflows.